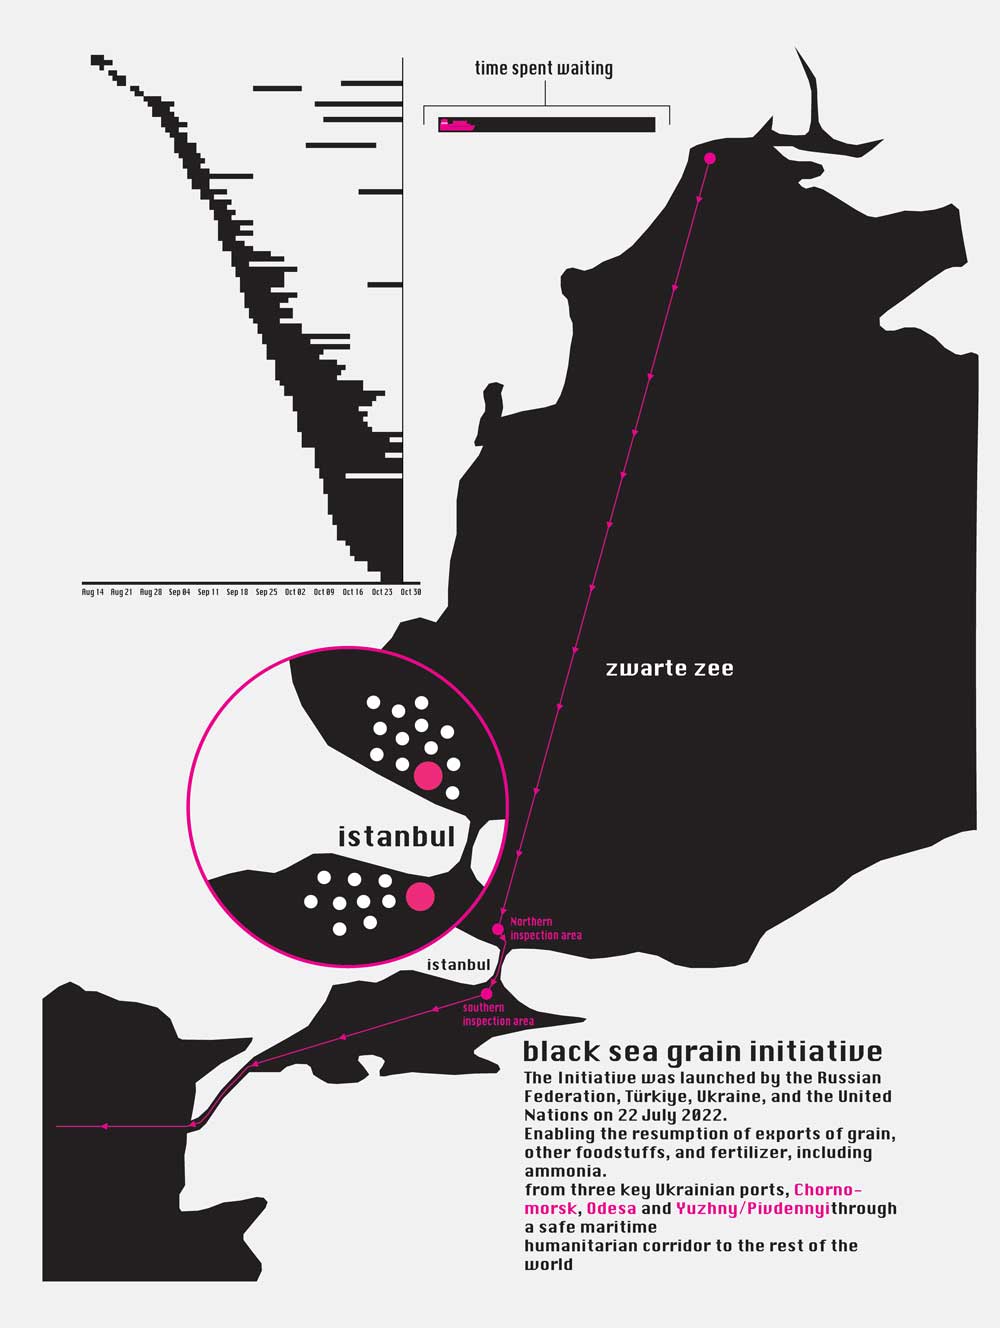
Data visualization of grain exports from Ukraine to the rest of the world involves collecting data from cargo ships. This enables the creation of a Gantt chart displaying the ships' extended waiting times. Utilizing a map provides insight into their location, route, and a detailed view highlighting where delays occur.
© 2024 Natan Verbeelen.