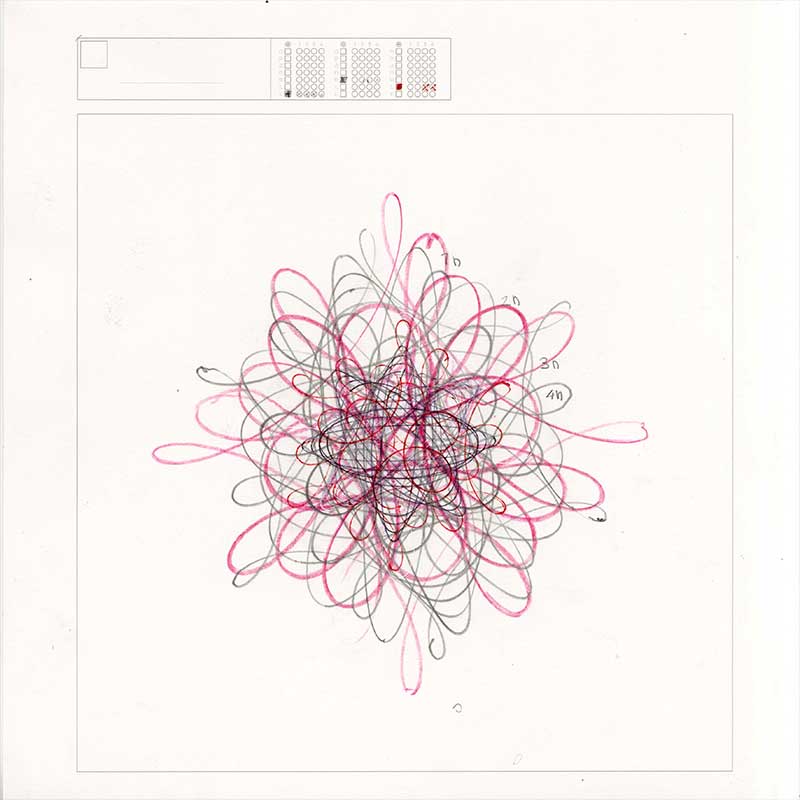
visualising sound by translateing oscillating sound to shape.
spirograph kit designed to create two-dimensional representations of atomic electron orbits.
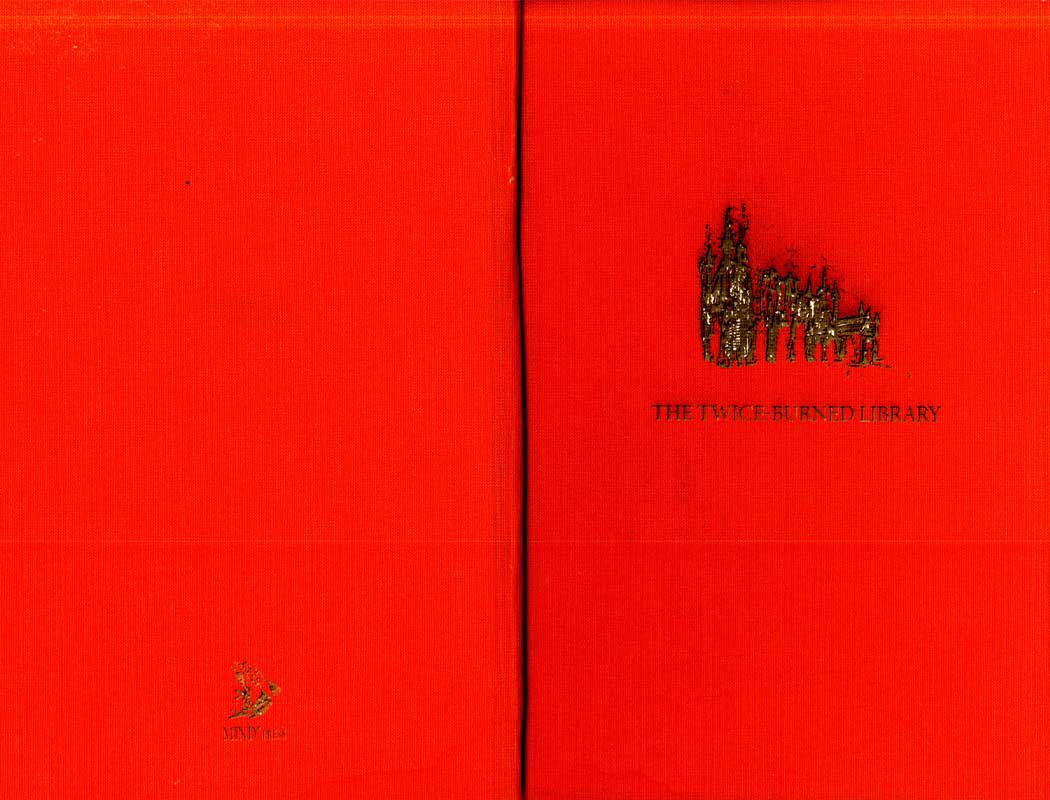
Redesign of the book The Twice-Burned Library, paying attention to The typography, layout, readability and visual appeal.
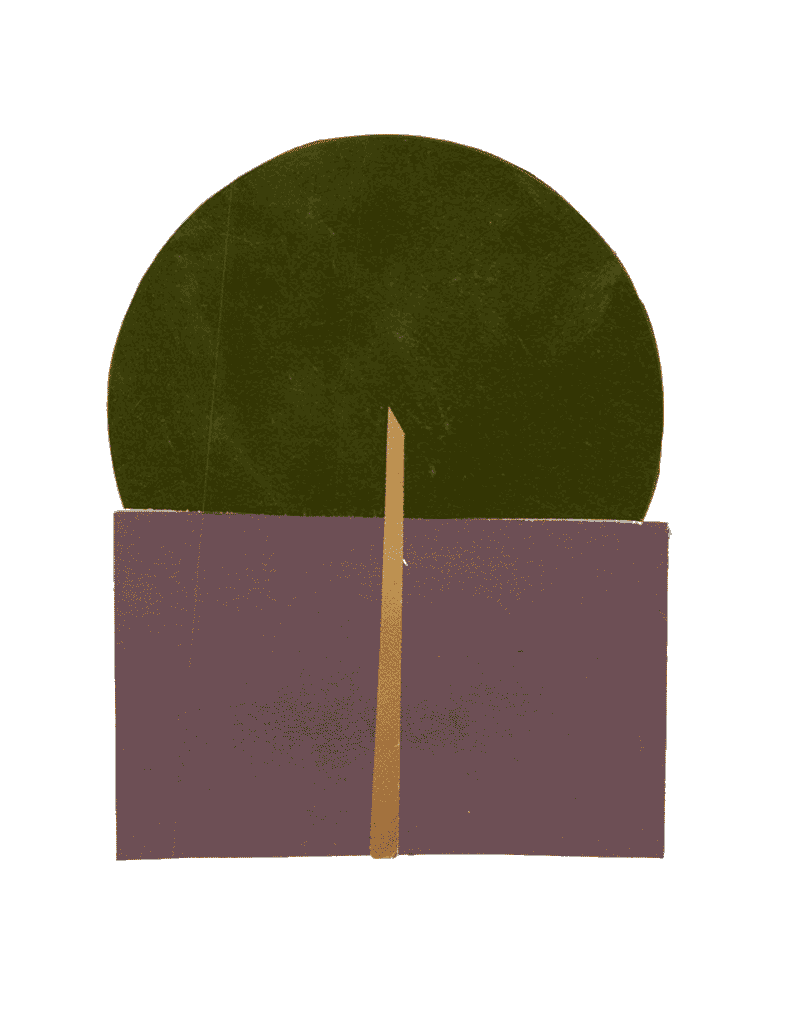
visualising color relations with the art of colage.
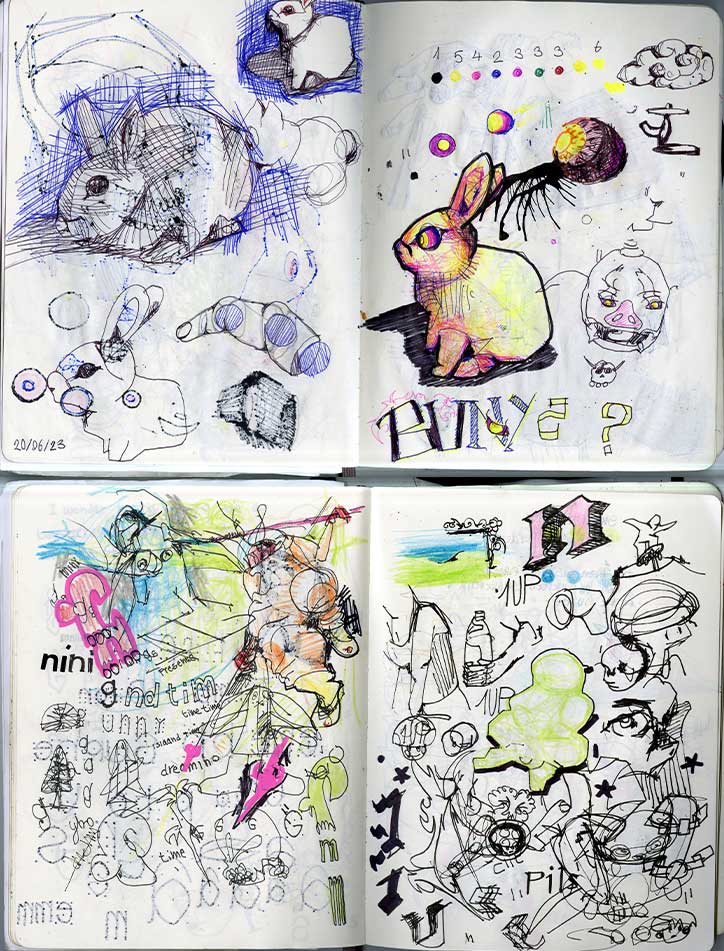
sketches and ilustrations
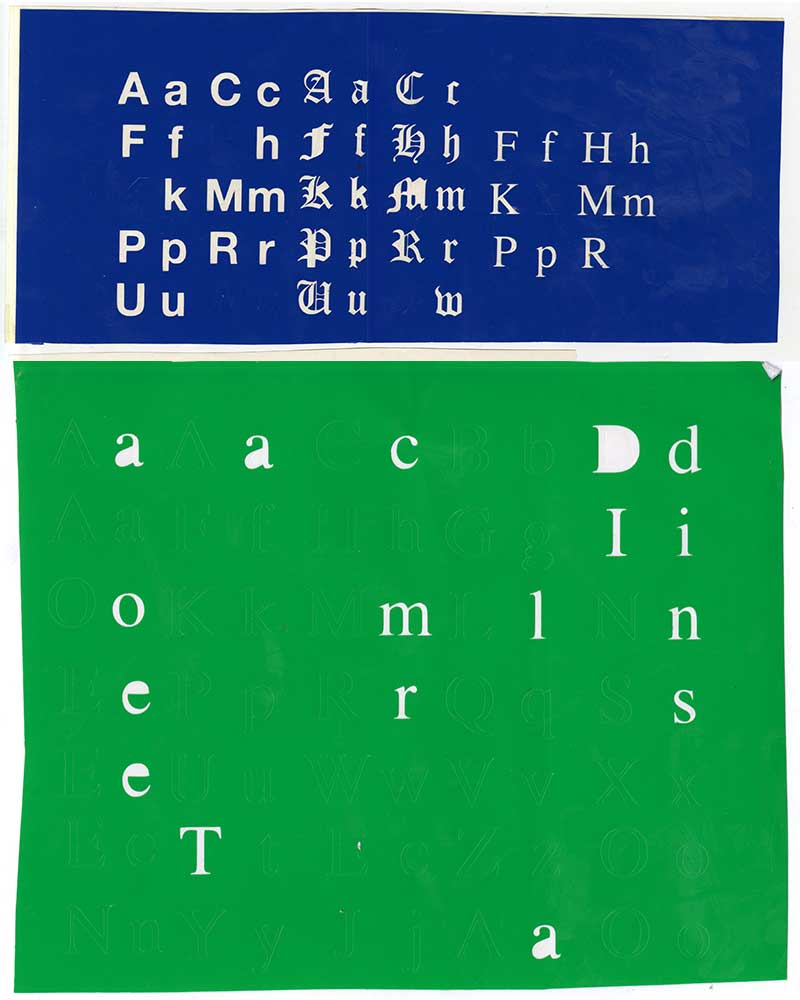
Crafted stickers from Helvetica, Times New Roman, and Canterbury.
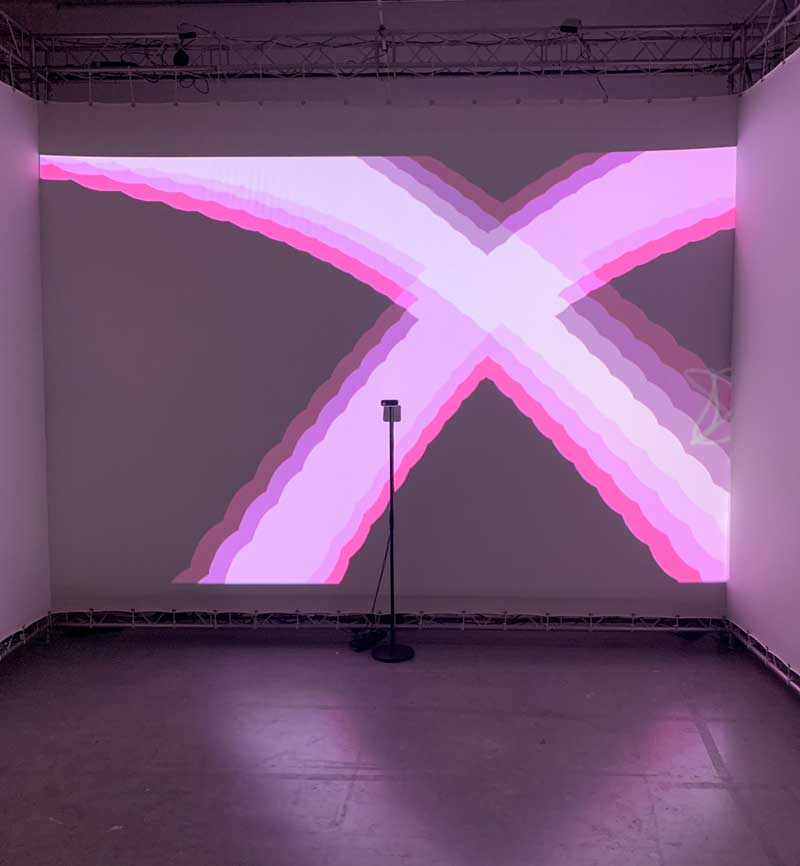
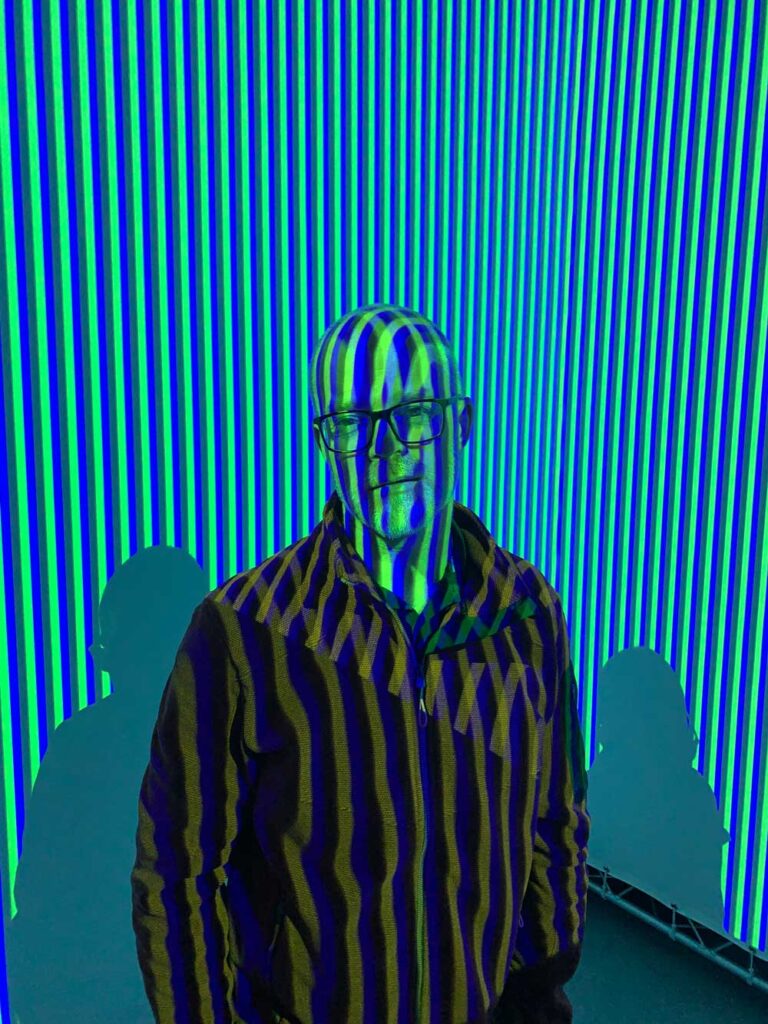
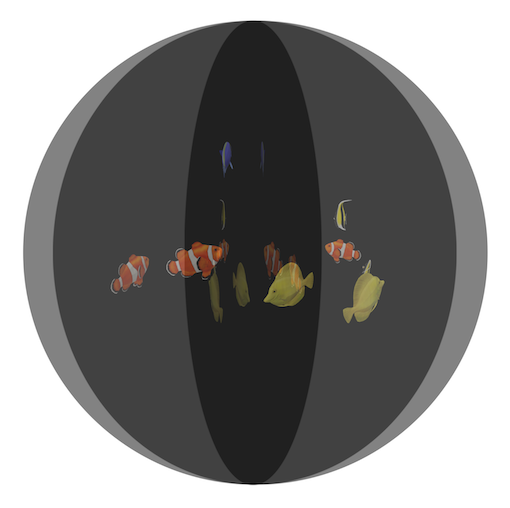
Engaging with RGB and Resolution through Spatial Computing
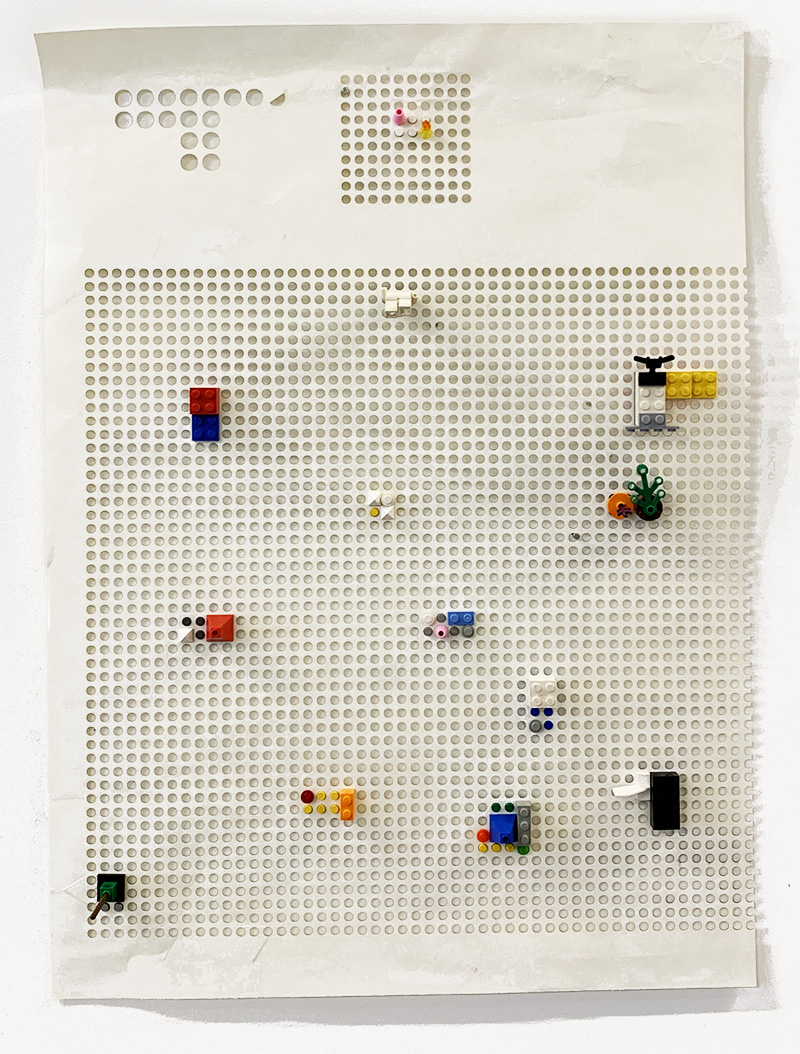
Using Lego and paper to create a static display.
creating 3D illusions with simple available materials and u can DIY your self inspired by crossed-plane-based models and renaissance perspective drawing tools.
a story using satellite observations. to highlight our climate's evolution.
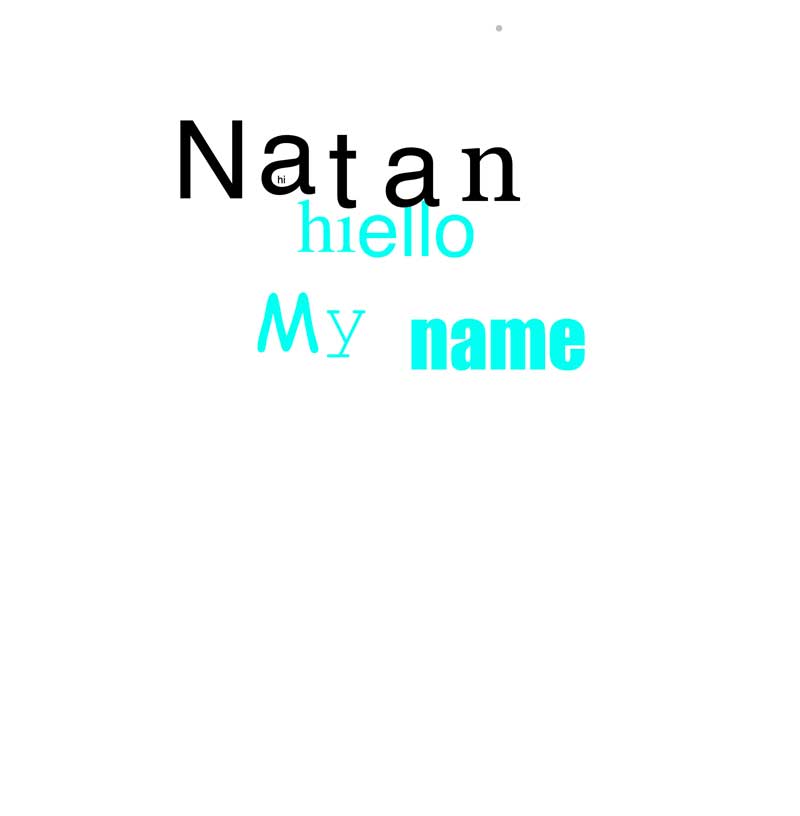
web tool to play with type
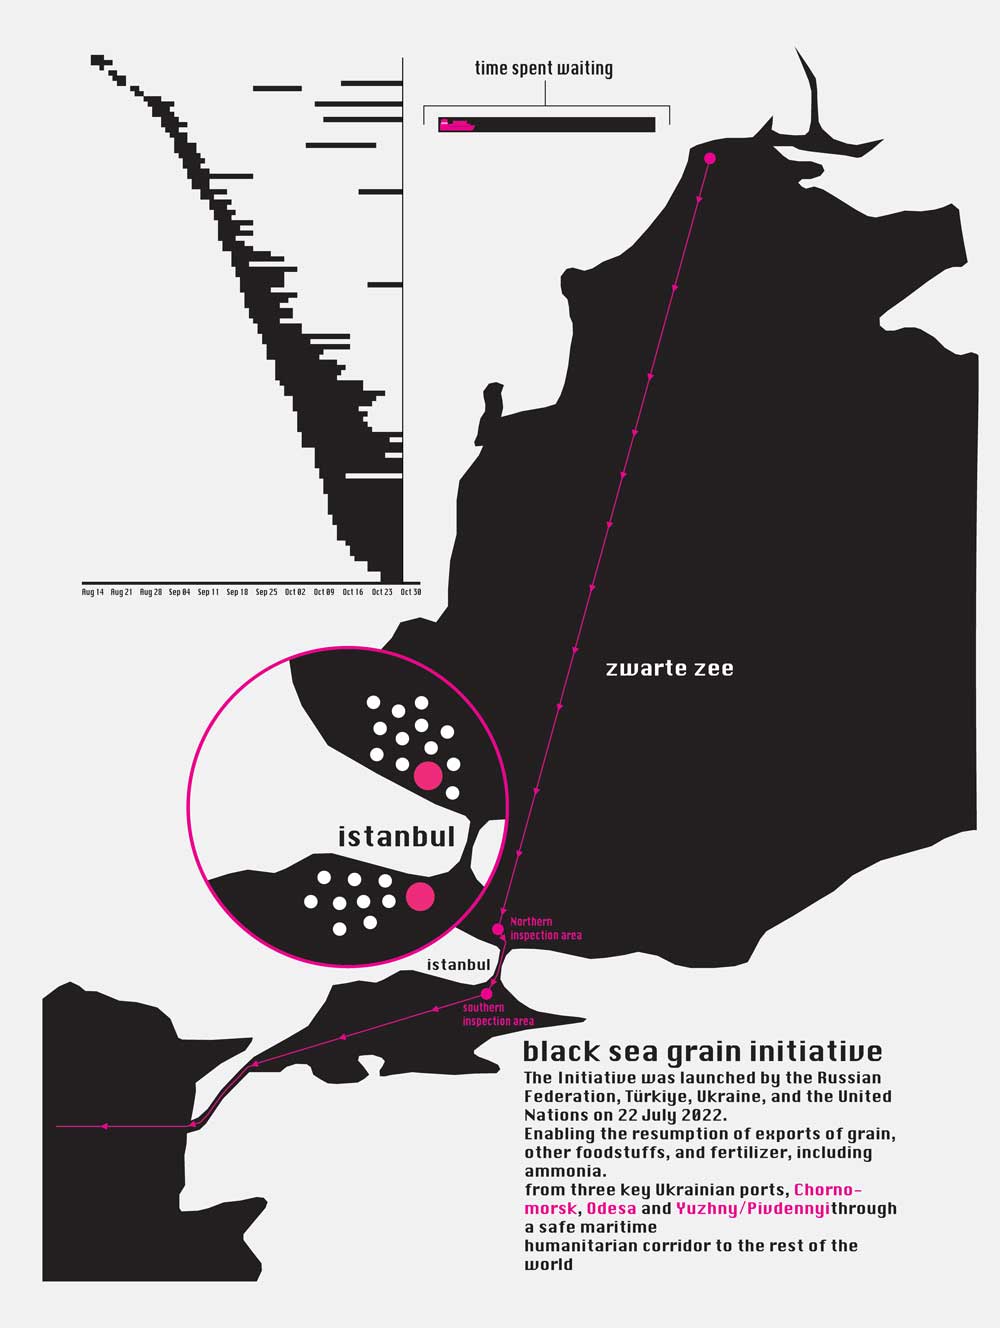
Data visualization of grain exports from Ukraine to the rest of the world.
© 2024 Natan Verbeelen.